Your skin is a real-time metabolic dashboard. When you eat high-glycemic foods late in the day, the pattern may be associated with two different outcomes: short-term morning puffiness and long-term structural change associated with glycation.
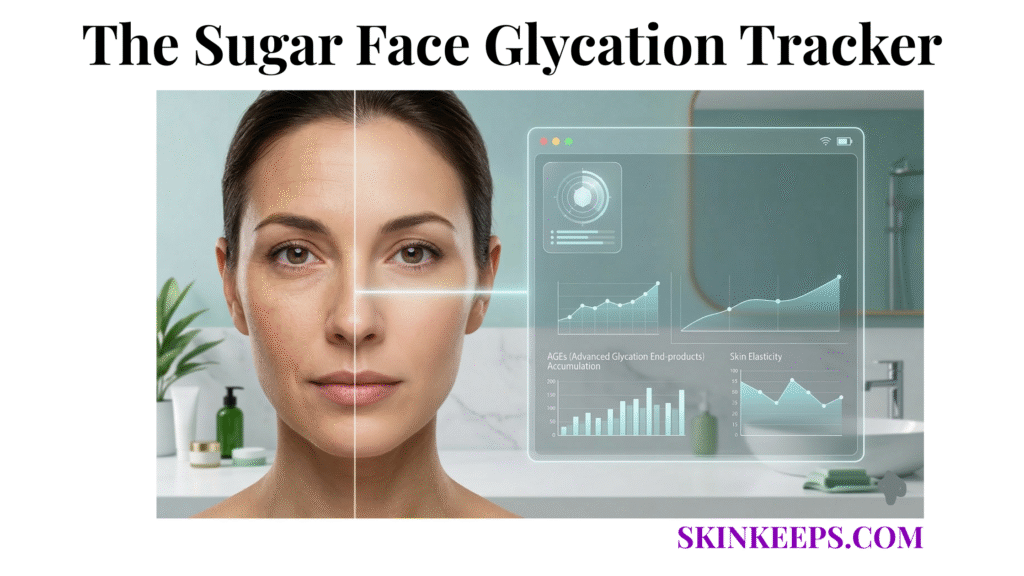
What is this? The Sugar Face Glycation Tracker is a 7-day logging method (Heuristic Guideline) that compares your evening glycemic load with next-morning facial puffiness and radiance. It is designed to test whether a repeatable pattern exists between your dinner plate and your mirror, serving as a tool for pattern-testing rather than medical diagnosis.
This document is for educational self-tracking purposes only and does not constitute medical advice. This template helps you test whether your own data shows a consistent pattern between evening glycemic load and next-morning puffiness/radiance, shifting attention from topical fixes to metabolic inputs.
Why Is the Sugar Face Glycation Tracker Important? (The Science)
High-glycemic patterns may show up on two timelines: rapid fluid shifts that change facial appearance overnight and slower glycation changes that alter collagen behavior over time (1–3). Gkogkolou & Böhm (2012) explain that Advanced Glycation End-products (AGEs) are contributors to skin aging mechanisms, which supports why the Tracker separates short-term “appearance signals” from long-term “structure signals” (2).
The Mechanism (Insulin & Inflammation)
In the Sugar Face Glycation Tracker, late high-glycemic eating is treated as the key variable because it is associated with higher post-meal insulin signaling (4, 5). Diet–skin literature discusses insulin-linked signaling (including IGF-1 pathways) as a plausible bridge between dietary glycemic patterns and inflammatory skin outcomes, which is why the Tracker treats late high-glycemic eating as a meaningful variable to test (4, 5). IGF-1 (insulin-like growth factor-1) is a growth-related signaling hormone discussed in diet–skin pathways, often mentioned alongside insulin signaling in dermatology nutrition reviews (4, 5).
Immediate vs. Long-Term Damage
In the Sugar Face Glycation Tracker, puffiness is logged as the short-term “appearance signal,” while glycation is tracked as the long-term “structure signal” (1–3). Morning puffiness is logged as a measurable physical sign (Heuristic Description) because edema has multiple causes and the Tracker is testing patterns, not diagnosing disease. Is it aging? Or is it dessert?
Glycation forms when sugars react with proteins through the Maillard Reaction and create Advanced Glycation End-products (AGEs), which is associated with mechanisms that include collagen cross-linking and reduced elasticity over time (1–3). The Maillard Reaction is the chemical process where sugar bonds to protein, similar to the browning of food when cooked. AGEs are the rigid byproducts of this reaction that accumulate in tissue. Cross-linking occurs when these AGEs bind adjacent collagen fibers together, making them stiff rather than flexible. Think of the “Toast Analogy”: glycation creates permanent browning and stiffening of collagen. Once the bread is toasted, you cannot un-toast it.
What Is the Research Protocol for the Sugar Face Glycation Tracker?
The Sugar Face Glycation Tracker protocol isolates evening glycemic load as the independent variable and reduces obvious puffiness confounders so the log can reveal patterns (4). Katta & Desai (2014) summarize diet-dermatology interventions, supporting structured dietary control as a reasonable self-experiment framework (4).
Defining the Outcome
In the Sugar Face Glycation Tracker, the target outcome is a repeatable “next-morning face” pattern—puffiness and dullness that clusters after specific evening meals.
Controlling the Confounders
In the Sugar Face Glycation Tracker, controls reduce false attribution by preventing sodium, alcohol, sleep loss, posture, or cycle-related fluid shifts from masquerading as “sugar face.”
- Independent Variable: Evening glycemic load within 3–4 hours of bed (Heuristic Guideline). Glycemic Load (GL) is calculated as (carbohydrate grams × glycemic index) ÷ 100 (Standard Definition).
- Sodium: High sodium intake may increase fluid retention, so keep sodium stable during the tracking week (6).
- Alcohol: Alcohol may contribute to dehydration, sleep disruption, and systemic inflammation which can mimic “sugar face” (Heuristic Description). You must consume zero alcohol during the 7-day test (Heuristic Guideline).
- Posture: Face-down sleeping can increase morning facial swelling (Heuristic Description).
- Sleep: Keep sleep consistent (7–9 hours) to reduce fatigue-related puffiness variability (Heuristic Guideline).
- Menstrual Cycle: Track cycle phase because fluid retention varies across the cycle (9).
How Do You Track Data in the Sugar Face Glycation Tracker?
The Sugar Face Glycation Tracker works only if you log daily using the same simple scales for seven days (Heuristic Guideline). Burke et al. (2011) conducted a systematic review of 22 studies linking frequent self-monitoring with improved behavior outcomes, supporting the need for daily logging discipline (10).
Metrics to Track
In the Sugar Face Glycation Tracker, dinner description and next-morning scores create the minimum dataset needed to compare “high” vs. “low” evenings.
- Puffiness Score 1–10: 1 being “sculpted/normal” and 10 being “extremely swollen/unrecognizable” (Heuristic Guideline).
- Glow Score 1–10: 1 being “dull/grey” and 10 being “radiant/vibrant” (Heuristic Guideline).
The Quantitative Data Log (7-Day Template)
| Day | Dinner Description | Est. Sugar/Carb | Morning Puffiness (1-10) | Skin “Glow” (1-10) | Notes |
|---|---|---|---|---|---|
| Mon | |||||
| Tue | |||||
| Wed | |||||
| Thu | |||||
| Fri | |||||
| Sat | |||||
| Sun |
Your Data Analysis
How Do You Analyze Sugar Face Glycation Tracker Results?
Sugar Face Glycation Tracker analysis compares averages from “high evenings” versus “low evenings” to see whether your scores move in a repeatable direction. Burke et al. (2011) supports the general principle that structured self-monitoring improves behavioral outcomes, which justifies turning the log into a simple rule-based comparison (10).
Step 1: Calculate “High Glycemic” Average
In the Sugar Face Glycation Tracker, “high days” are the days you flagged as high sugar/refined carbs, and you compute the average puffiness score for those days. Sum the puffiness scores from all “High” days and divide by the number of “High” days.
Step 2: Calculate “Low Glycemic” Average
In the Sugar Face Glycation Tracker, “low days” are the days you flagged as low/none, and you compute the average puffiness score for those days.
The Insight
In the Sugar Face Glycation Tracker, the insight is the gap between averages, which suggests whether your face has a low or high evening threshold. For example, if your High Average is 7.5 and your Low Average is 2.0 (Heuristic Example), the data suggests a correlation between evening intake and morning appearance.
How Do You Fix the Problem Using the Sugar Face Glycation Tracker?
The Sugar Face Glycation Tracker fix is behavioral—timing, substitution, and repeat testing—because the tool is designed to adjust inputs, not “treat” skin. Smith et al. (2008) found in an RCT that a low-glycemic-load diet improved acne-related outcomes over 12 weeks, supporting that glycemic pattern changes can shift skin endpoints (8).
Action Plan
In the Sugar Face Glycation Tracker, the action plan repeats the test with a tighter cutoff to see whether your morning scores drop.
- Rule: No sugar/white carbs 3–4 hours before bed for 7 days (Heuristic Guideline).
- Fallback: “If bedtime varies, use ‘last meal’ timing instead of strict clock time.”
- Goal: Average puffiness < 2.5 or clearly below baseline (Heuristic Goal).
- Substitution: Choose lower-GL options (e.g., berries, yogurt, nuts) to keep the evening glycemic load lower (Heuristic Guideline).
Key Takeaways from the Sugar Face Glycation Tracker
The key methodological takeaways from the Sugar Face Glycation Tracker are:
- Identify the Culprit: Often, what is blamed on “genetics” or “aging” is associated with dinner choices.
- Track the Load: Use the Sugar Face Glycation Tracker to log evening carbs against morning puffiness.
- Control the Variables: Avoid alcohol and keep sodium moderate during the tracking week to reduce confounding puffiness signals.
- Reduce the Spike: Minimize insulin spikes late in the day to reduce the likelihood of inflammatory signaling that may contribute to collagen cross-linking mechanisms.
Frequently Asked Questions
A: It suggests one of three things: your skin is metabolically resilient, your “Low” days weren’t low enough to create a significant contrast, or a confounder (like high sodium or hormonal timing) is dominating the signal. The lack of a pattern is still data—it means sugar might not be your primary inflammatory trigger.
A: Yes. Whole fruit contains fiber, which blunts the insulin response compared to refined sugars. The Sugar Face Glycation Tracker targets high-glycemic, acellular carbohydrates (flours, syrups, candy, juice) consumed late at night.
A: Think back to the “Toast Analogy.” Once bread is toasted, it is hard to un-toast. Cross-linked collagen is difficult to repair, which is why prevention is the primary strategy. However, removing the inflammatory “fire” often results in an immediate improvement in skin clarity and hydration, even if deep structural changes remain.
A: While this tracker focuses on puffiness (edema) and aging (glycation), the mechanism is similar. High insulin spikes can stimulate sebum production. Many users find that lowering evening glycemic load reduces breakout frequency, though this is a secondary observation.
Conclusion
The Sugar Face Glycation Tracker provides a structured method to test for a consistent pattern between diet and skin appearance, distinguishing between temporary edema and permanent glycation damage. By managing evening glycemic load, you may notice less morning puffiness the next morning and protect your collagen from becoming brittle and yellow over the long term.
Reference List
- Nguyen HP, Katta R. Sugar Sag: Glycation and the Role of Diet in Aging Skin. Skin Therapy Lett. 2015;20(6):1-5. Available from: https://pubmed.ncbi.nlm.nih.gov/26604725/
- Gkogkolou P, Böhm M. Advanced glycation end products: Key players in skin aging? Dermatoendocrinol. 2012;4(3):259-270. Available from: https://www.ncbi.nlm.nih.gov/pmc/articles/PMC3583887/
- Danby FW. Nutrition and aging skin: sugar and glycation. Clin Dermatol. 2010;28(4):409-11. Available from: https://pubmed.ncbi.nlm.nih.gov/20620757/
- Katta R, Desai SP. Diet and dermatology: the role of dietary intervention in skin disease. J Clin Aesthet Dermatol. 2014;7(7):46-51. Available from: https://www.ncbi.nlm.nih.gov/pmc/articles/PMC4106357/
- Burris J, Rietkerk W, Woolf K. Acne: the role of medical nutrition therapy. J Acad Nutr Diet. 2013;113(3):416-30. Available from: https://pubmed.ncbi.nlm.nih.gov/23438493/
- He FJ, MacGregor GA. A comprehensive review on salt and health and current experience of worldwide salt reduction programmes. J Hum Hypertens. 2009;23(6):363-84. Available from: https://pubmed.ncbi.nlm.nih.gov/19110538/
- Higgins EM, du Vivier AW. Alcohol and the skin. Clin Dermatol. 1999;17(4):437-41. Available from: https://pubmed.ncbi.nlm.nih.gov/10497728/
- Smith RN, et al. The effect of a low-glycemic-load diet on acne vulgaris and the fatty acid composition of skin surface triglycerides. J Dermatol Sci. 2008;50(1):41-52. Available from: https://pubmed.ncbi.nlm.nih.gov/18178063/
- White CP, et al. Fluid retention over the menstrual cycle: 1-year data from the Prospective Ovulation Cohort. Obstet Gynecol Int. 2011;2011:138451. Available from: https://pubmed.ncbi.nlm.nih.gov/21845193/
- Burke LE, et al. Self-monitoring in weight loss: a systematic review of the literature. J Am Diet Assoc. 2011;111(1):92-102. Available from: https://pubmed.ncbi.nlm.nih.gov/21185970/